
ccusage is now 2.5× faster with 2.7× less memory
November 22, 2026 · ryoppippi
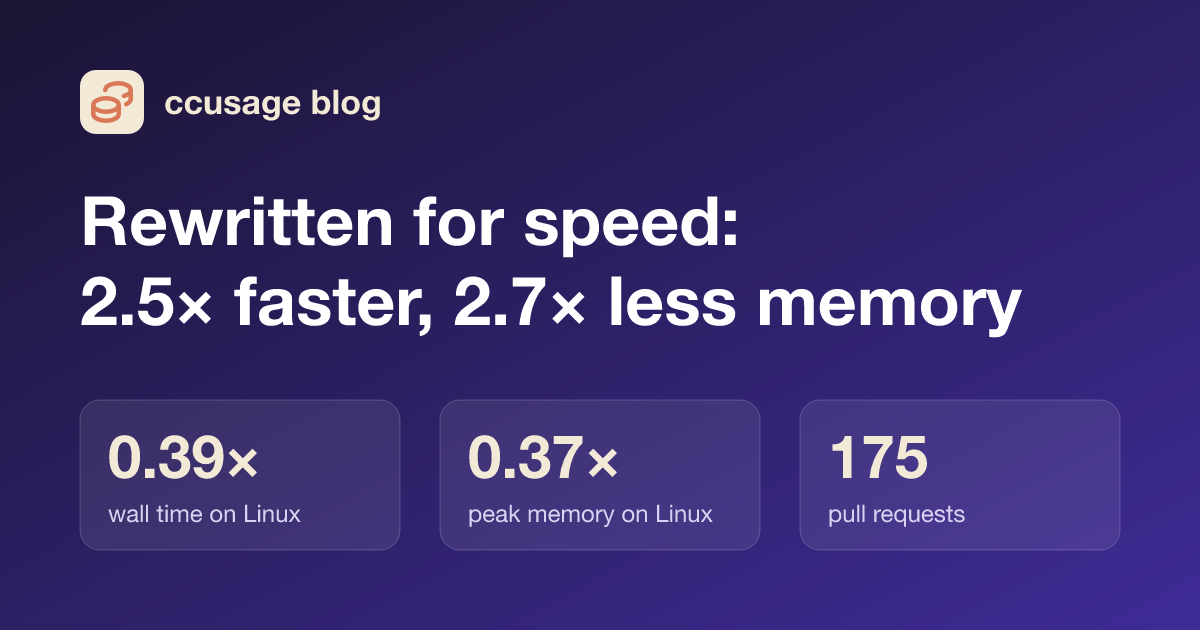
Over the last two weeks, ccusage went through a deep rework of its Rust core: 175 pull requests that touched parsing, pricing, threading, the allocator, the build, and the way we test all of it. The result: every report is faster and uses much less memory than in v20.0.51, and costs are more accurate for many models.
These changes ship in the next release, v20.1.0. This post covers the numbers, where the speed came from, what changed in your reports, and how we made sure nothing changed that shouldn't have.
The numbers
We compared the final build against v20.0.51 (pre-refactor main). Both are the shipped release builds, measured on generated fixtures on clean Linux and macOS machines. The headline is the geometric mean over nine commands; lower is better.
| Wall time | CPU time | Peak memory | |
|---|---|---|---|
| Linux x64 (32 vCPU) | 0.39× | 0.49× | 0.37× |
| macOS arm64 (12 CPU) | 0.42× | 0.55× | 0.41× |
On a maintainer's real logs, reports take 0.45× the wall time and 0.43× the peak memory. We measured that locally on copies of the logs, and only ratios left the machine.
Measured times on benchmark machines
Ratios hide how long you actually wait, so here are the measured times. The input is the generated benchmark data from our CI: 10.3 GiB of Claude Code logs, 14.2 GiB of Codex logs (4.5 GiB compressed on disk), and a 256 MiB OpenCode database. The ccusage daily row reads the Claude, Codex, and Grok data together. Wall time is the mean of 15 runs after 3 warmups, measured with hyperfine; the OpenCode rows use the shell's time over 15 interleaved runs after 3 warmups instead, because hyperfine skews multi-threaded runs (#2461). Peak memory is the median of 5 runs (15 for OpenCode).
Linux x64, 32 vCPU
| Command | Wall time, v20.0.51 → now | Peak memory, v20.0.51 → now |
|---|---|---|
ccusage claude daily | 1.23 s → 0.54 s | 1,941 MiB → 512 MiB |
ccusage claude session | 1.48 s → 0.86 s | 2,005 MiB → 1,037 MiB |
ccusage claude blocks | 1.56 s → 1.04 s | 1,997 MiB → 1,106 MiB |
ccusage claude daily --since … | 0.86 s → 0.28 s | 1,005 MiB → 255 MiB |
ccusage codex daily | 2.85 s → 1.01 s | 1,403 MiB → 521 MiB |
ccusage codex session | 3.05 s → 1.12 s | 1,441 MiB → 543 MiB |
ccusage daily (Claude, Codex, Grok) | 3.50 s → 1.33 s | 1,963 MiB → 914 MiB |
ccusage opencode daily | 436 ms → 127 ms | 94 MiB → 31 MiB |
ccusage opencode session | 483 ms → 129 ms | 96 MiB → 31 MiB |
macOS, Apple silicon, 12 CPU
| Command | Wall time, v20.0.51 → now | Peak memory, v20.0.51 → now |
|---|---|---|
ccusage claude daily | 1.10 s → 0.48 s | 1,842 MiB → 522 MiB |
ccusage claude session | 1.30 s → 0.61 s | 2,108 MiB → 1,078 MiB |
ccusage claude blocks | 1.35 s → 0.71 s | 2,103 MiB → 1,097 MiB |
ccusage claude daily --since … | 0.65 s → 0.31 s | 750 MiB → 258 MiB |
ccusage codex daily | 2.99 s → 1.33 s | 1,488 MiB → 487 MiB |
ccusage codex session | 2.93 s → 1.31 s | 1,568 MiB → 523 MiB |
ccusage daily (Claude, Codex, Grok) | 3.50 s → 1.63 s | 2,170 MiB → 815 MiB |
ccusage opencode daily | 410 ms → 119 ms | 64 MiB → 34 MiB |
ccusage opencode session | 408 ms → 119 ms | 64 MiB → 35 MiB |
Where the speed came from
There was no single trick. The gains add up from many small, measured changes:
- Parsing on every core. Codex logs are now parsed in parallel on every core up to 16 (#2481). That makes Codex reports up to 39% faster on 2–12-core machines.
- Reading less.
--sinceskips Claude logs that cannot contain matching usage, even when their modification times are stale (#2432, #2462). - No lock contention in SQLite. OpenCode reports were spending CPU on SQLite's heap-accounting mutex and the system allocator. Turning off the unused accounting and routing SQLite's allocations through mimalloc cut their CPU time by 46–47% on Linux (#2486).
- Less memory from the allocator. On Linux, stopping the allocator from asking for transparent huge pages cut daily-report peak memory by 27–29% (#2482). macOS now uses mimalloc too (#2450).
- Lazy pricing. The embedded pricing catalog stays compressed until a lookup needs it (#2491), which cut the instructions of small reports by 37%.
- A faster build. Release binaries are now built with profile-guided optimization on Linux and Apple silicon (#2457). Our own code and every dependency except SQLite are compiled at the highest optimization level (#2458, #2518).
The trade-off: a bigger download
Speed came first, and it cost some binary size. The npm download for Linux x64 grew by 0.90 MB (gzip), and the macOS arm64 download by 0.91 MB. Most of that is profile-guided optimization and the higher optimization level. We measured each of those levers on its own and kept only the ones that paid for their size. For example, building SQLite for speed would have added another 0.3 MB for at most 3% on one command, so we left it out.
| Binary | v20.0.51 | Now | Change |
|---|---|---|---|
| Linux x64 | 5.32 MB | 7.16 MB | +34.5% |
| Linux x64, gzip (npm download) | 2.68 MB | 3.57 MB | +0.90 MB |
| macOS arm64 | 3.88 MB | 5.71 MB | +47% |
| macOS arm64, gzip | 2.27 MB | 3.18 MB | +0.91 MB |
More accurate costs
Some reported costs change in this release. That is intended: each change fixes a case where ccusage billed a model differently from its vendor.
- Gemini is billed as Google's own vendor, with its dated price changes. Vertex is billed as a separate host.
- Prompts over 200K tokens are billed as whole requests for Anthropic, Gemini, and xAI, including your
pricingOverrides. - A host's own listing (Bedrock, Azure, and others) is used before the vendor's list price.
- A vendor's free model used through a paid host is billed as a marked estimate (
estimatedPricing/estimatedModelsin JSON output) instead of $0. - Model IDs match the pricing catalog regardless of letter case, including overrides.
- DeepSeek V4 follows the vendor's current rates and cutoff.
- Tokens that no priced category explains are no longer billed or counted as output.
See Cost Calculation Modes for how ccusage picks a price.
Other changes you may notice
- A configured
projectnow filters every Claude report, not onlydaily. weeklyis available for every agent.- Codex
service_tier = "ultrafast"inconfig.tomlis honored for usage that records no tier. - SQLite-backed reports (Kilo, Hermes, OpenCode, and others) no longer crash intermittently on Apple silicon when several databases open at once (#2520).
How we checked that nothing else changed
A refactor this large is only useful if the reports stay right. Before calling it done, we compared the final build with v20.0.51 on:
- 816 golden report cases covering every agent, every report, and every major option (JSON, tables, date windows, cost modes, time zones, sort order);
- 43 synthetic cases for edge cases like
--lastaround today and DeepSeek's dated price change; - 205 cases on a maintainer's real logs, run on local copies, with only aggregate ratios kept.
Every difference was traced to the single pull request that introduced it, and every one matched that pull request's stated intent. There were zero unexplained changes.
Along the way, every pull request ran a performance comparison in CI, and the larger levers were measured on dedicated Linux and macOS machines before they landed.
What's next
- The summary pull request has the full per-command numbers and methodology.
- A few things were measured and deferred: Codex parsing stops scaling past about 22 threads on very large machines, and profile-guided builds are not yet byte-for-byte reproducible.
If a report looks slower or a cost looks wrong after you upgrade, please open an issue. The tables above are what we expect, and we'd like to know if your logs disagree.